2 - Basic visualization
Let’s continue by visualizing the spike data we created in Tutorial 1:
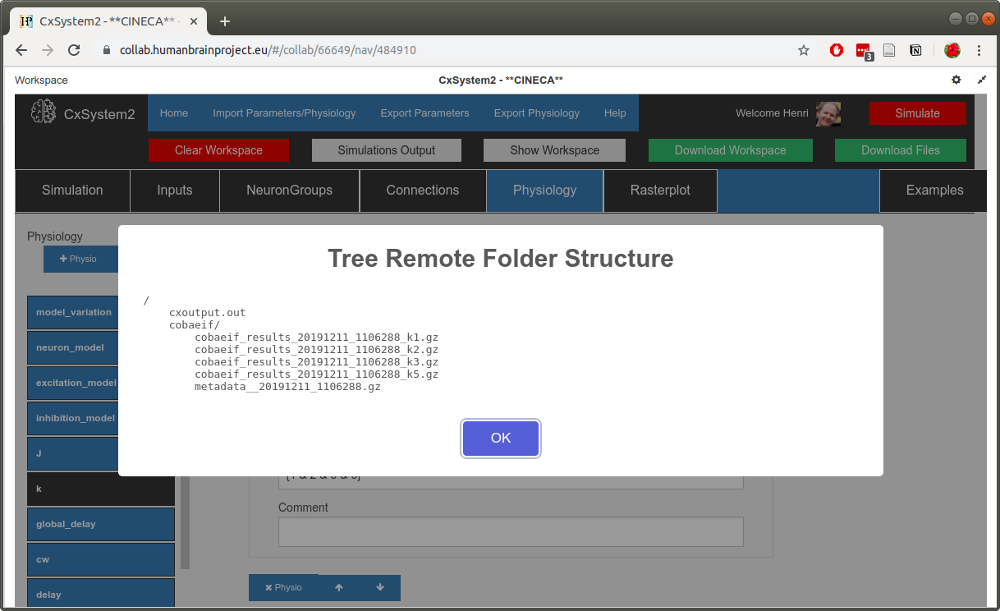
We actually did a small parameter search for the parameter k, which in this configuration means the relative weight of inhibitory synapses. Thus we have 4 data files containing spikes (plus the metadata file).
Now, from the workspace view (above), copy the timestamp of one of the simulation files (here 20191211_1106288). Then open up the Rasterplot tab:
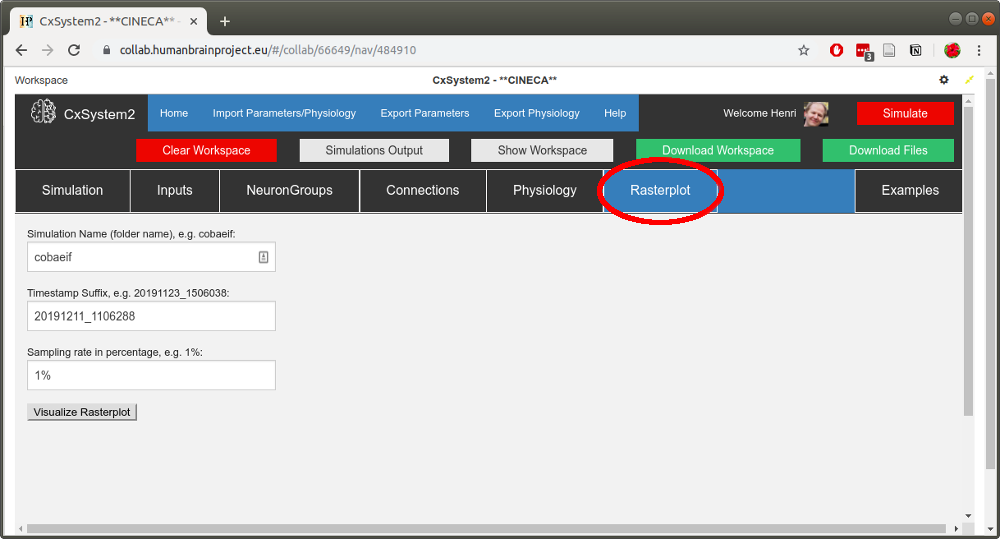
Fill in the simulation name (cobaeif) to the first text field and paste the timestamp to the second field. Leave the sampling rate as 1%: the current plotting method will create pdfs that are heavy to render if some of your simulations have a lot of spikes. (This visualization tool is intended only as a simple screening tool.)
When you have filled in the fields, hit the Visualize button. After a few seconds, a PDF with the spike data should open up:
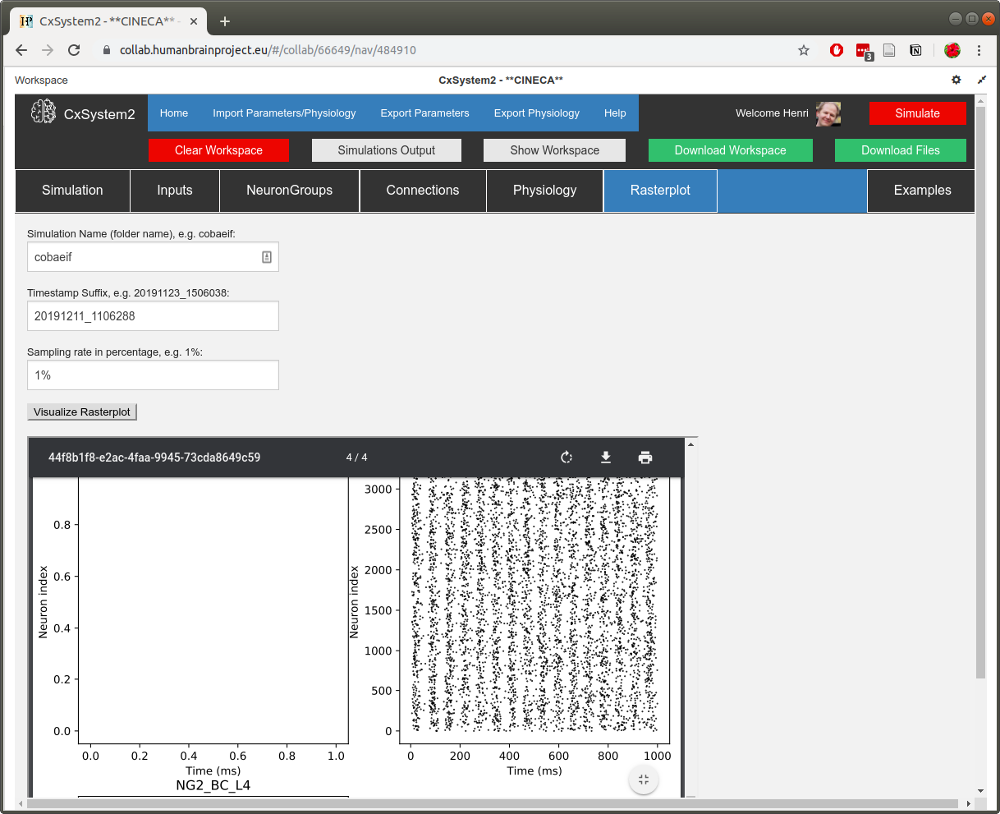
When you scroll down the pdf, you can see that there are four pages corresponding to the four simulation files. (In networks with more neuron groups to visualize, a single simulation will occupy multiple pages.) You can see that with k=1,2,3 (not that much inhibition) there is little variation in spike dynamics, but with k=5 the activity seems more rhythmic.
If you have CxSystem2 installed locally, you can download the simulation data to visualize it in
ViSimpl. Just click on the Download workspace button. After the download has finished, open up a
terminal window, unpack the file and use the cxvisualize command:
(CX2) henhok@taz:~: cd Downloads
(CX2) henhok@taz:~/Downloads$ tar xvfz workspace.tar.gz
304441/
304441/cxoutput.out
304441/cobaeif/
304441/cobaeif/cobaeif_results_20191211_1106288_k1.gz
304441/cobaeif/cobaeif_results_20191211_1106288_k2.gz
304441/cobaeif/cobaeif_results_20191211_1106288_k3.gz
304441/cobaeif/cobaeif_results_20191211_1106288_k5.gz
(CX2) henhok@taz:~/Downloads$ cxvisualize 304441/cobaeif/cobaeif_results_20191211_1106288_k5.gz
Setting OpenGL context to 4.4
...
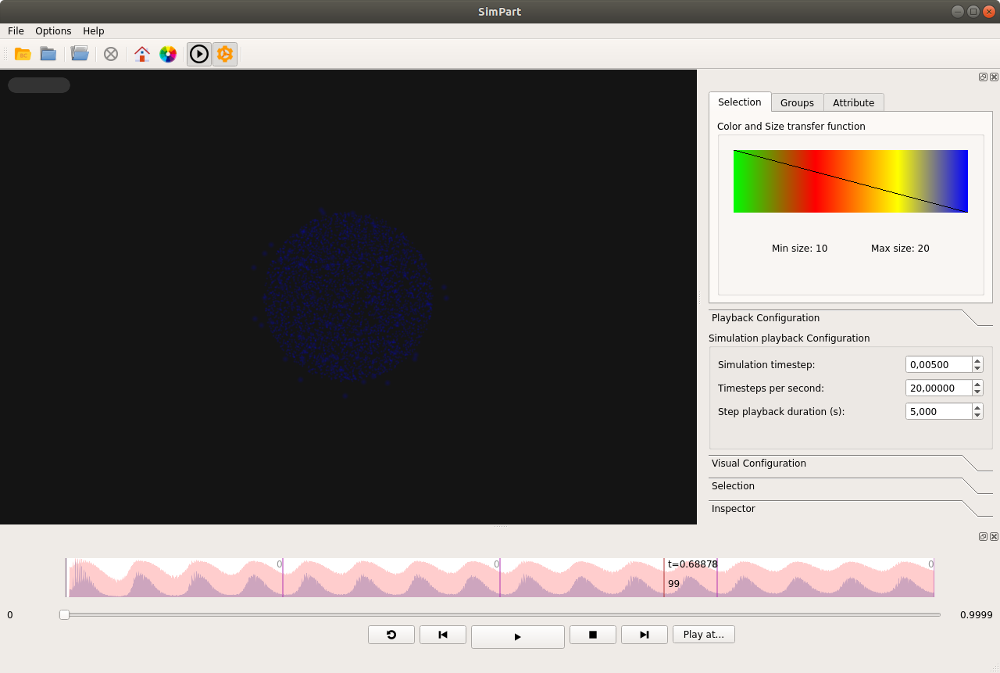
If the ViSimpl binary is available in the system path, the cxvisualize command should lauch
ViSimpl with the simulation data (for k=5 in this case):
Congratulations! If you want to do your own visualizations on the spike data using Python, please see the user’s guide.